
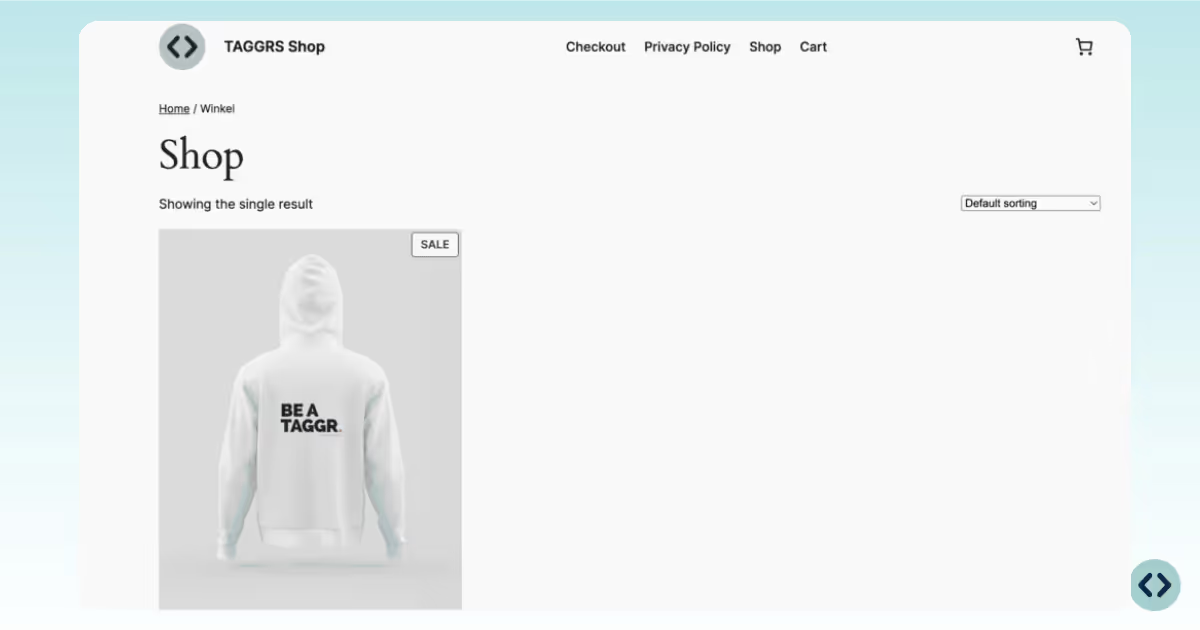
We focus on debugging our TAGGRS Demoshop, a basic E-commerce web shop. For testing, we set up different components to create a tracking environment:
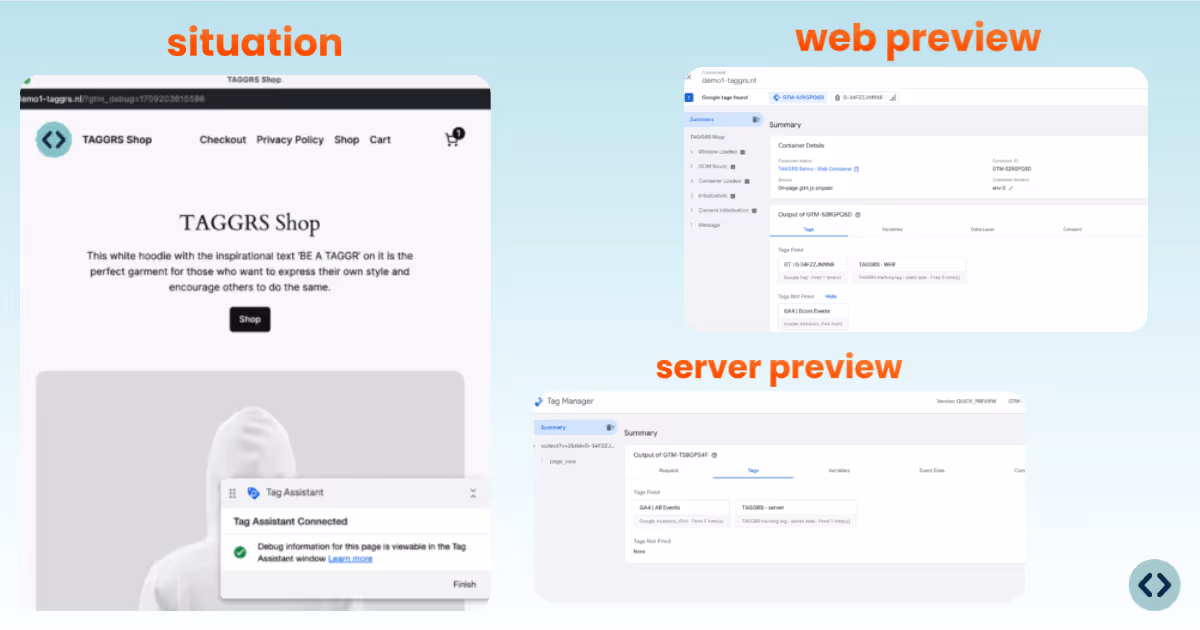
The debugging process in the server container differs from that in the web container in that you must enable preview mode for both web and server containers.
Watch the video below to follow the process step-by-step.
When opening the preview mode in GTM, differences between the Web and server containers become apparent. The server container introduces new tabs specific to its functionality.
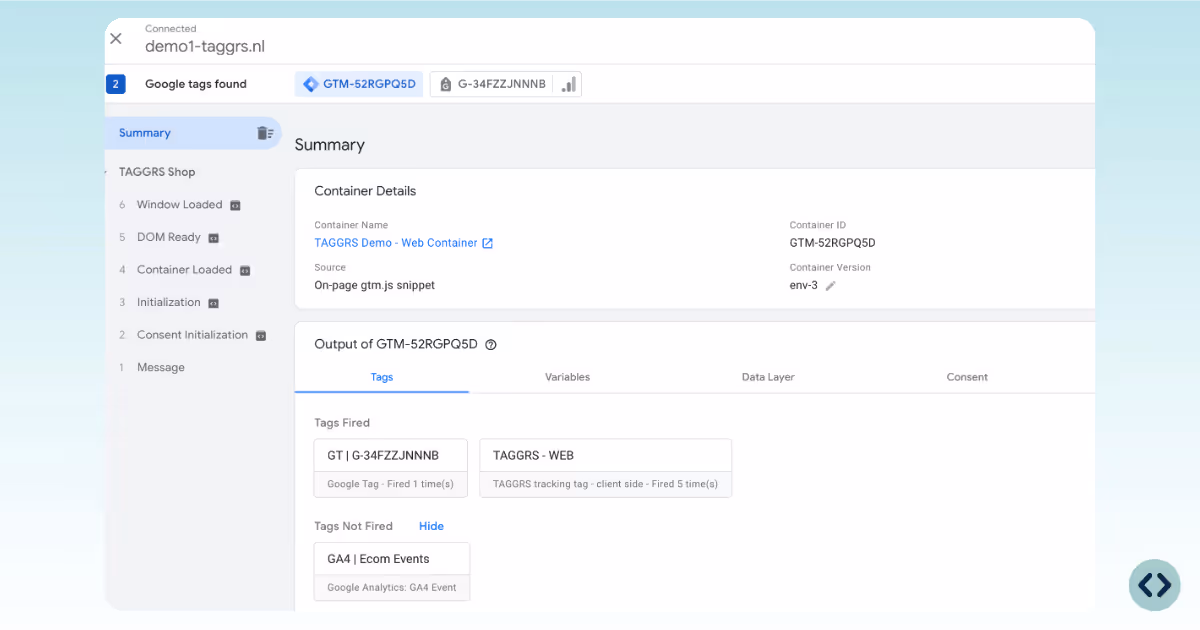
In the web container on the left, we see under summary:
In the Server Container, we see:
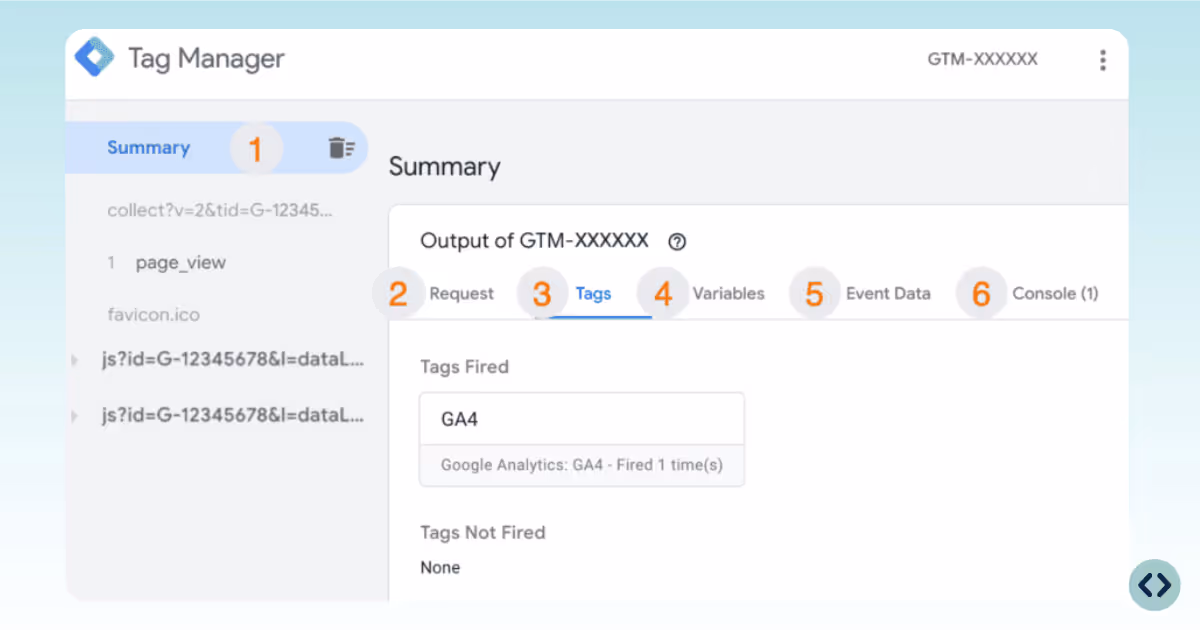
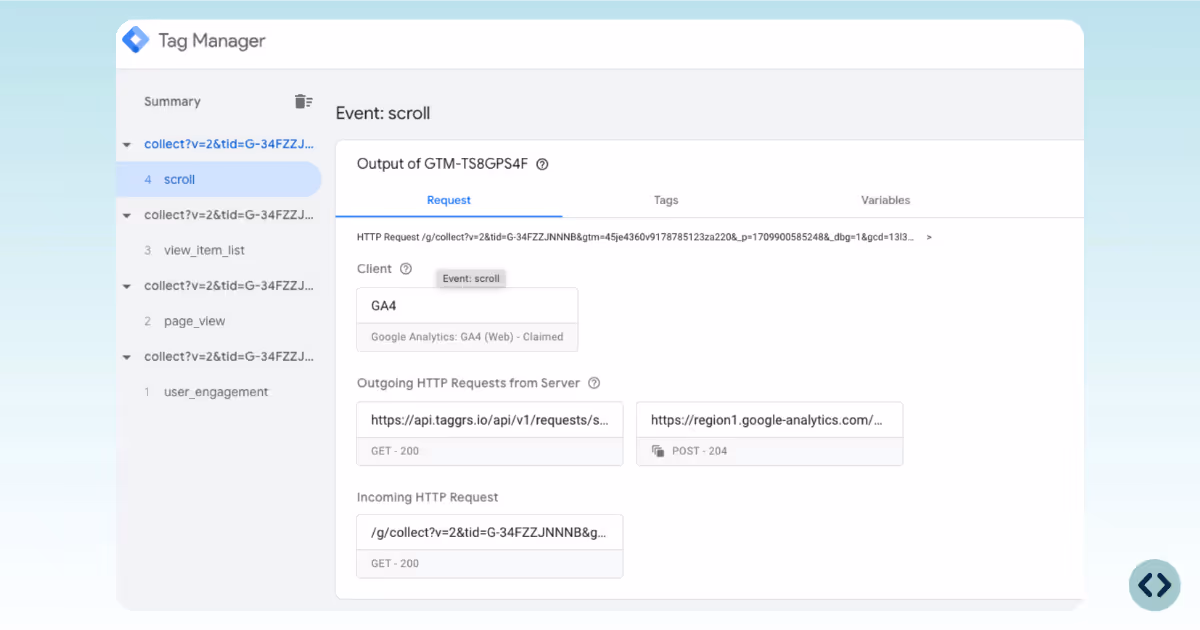
Under Summary in the server container, specific events are represented by the parameter collect?=v, which indicates the type of event being processed, for example, a GA4 event. Under collect is the event, which in this case is page_view.js?id=G-XXXXXXXX = Request from Google Tag JavaScript librarycollect?v=2 = GA4 requests
To check if data is coming in correctly to the server container, we first check if the server container has received data from the web container. We do this through the 'request' section within GTM. Here you can see which client has processed the incoming requests, which requests are coming in and which are going out.
Now that the data is successfully passed from the web container to the server container and then to Google Analytics, it's time to test whether our set tags are working correctly. We focus on testing a view item event in our TAGGRS Demo Webshop.
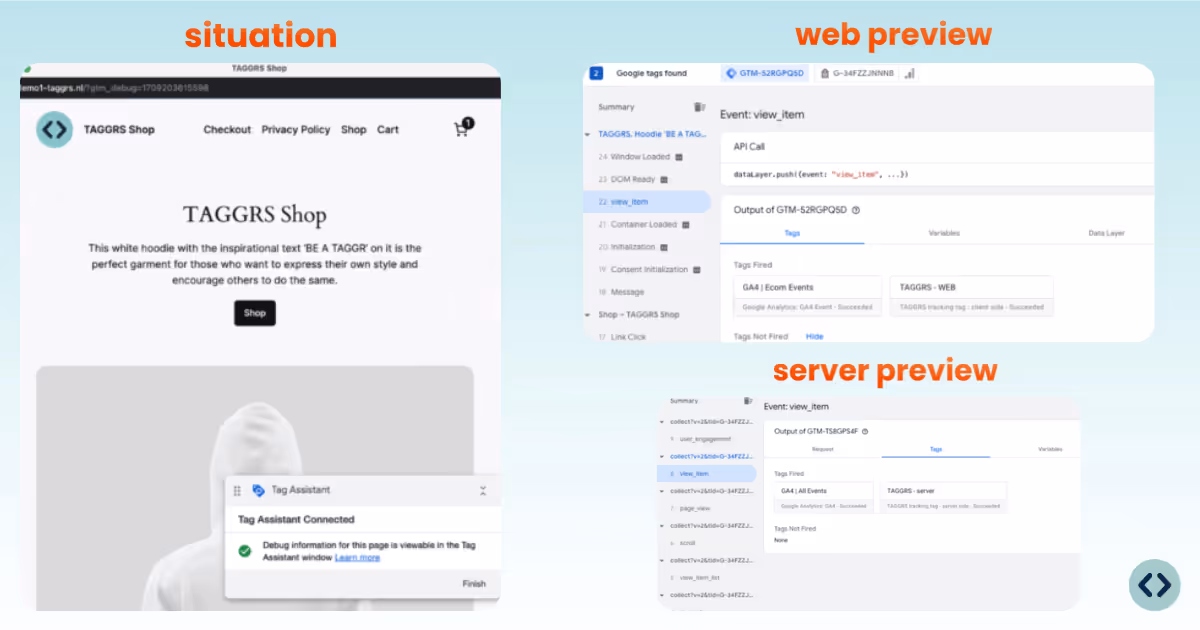
In the web container, we observe that two tags are activated: our GA4 event and the TAGGRS server tag. This is the time to verify that all the necessary tags are triggered as intended. When this happens, it confirms that the triggers are set correctly and the data is adequately forwarded to the server.
After the necessary tags are correctly activated, it is important to check what specific data these tags send with them. This can be viewed in the event data section within the server container. Here you will find all the data that has been passed from the web container to the server container. For a 'view item' event in our demo shop, for example, we want information such as the product's price, name, and possibly an ID to be forwarded. This segment allows you to verify that the variables created are passed correctly.
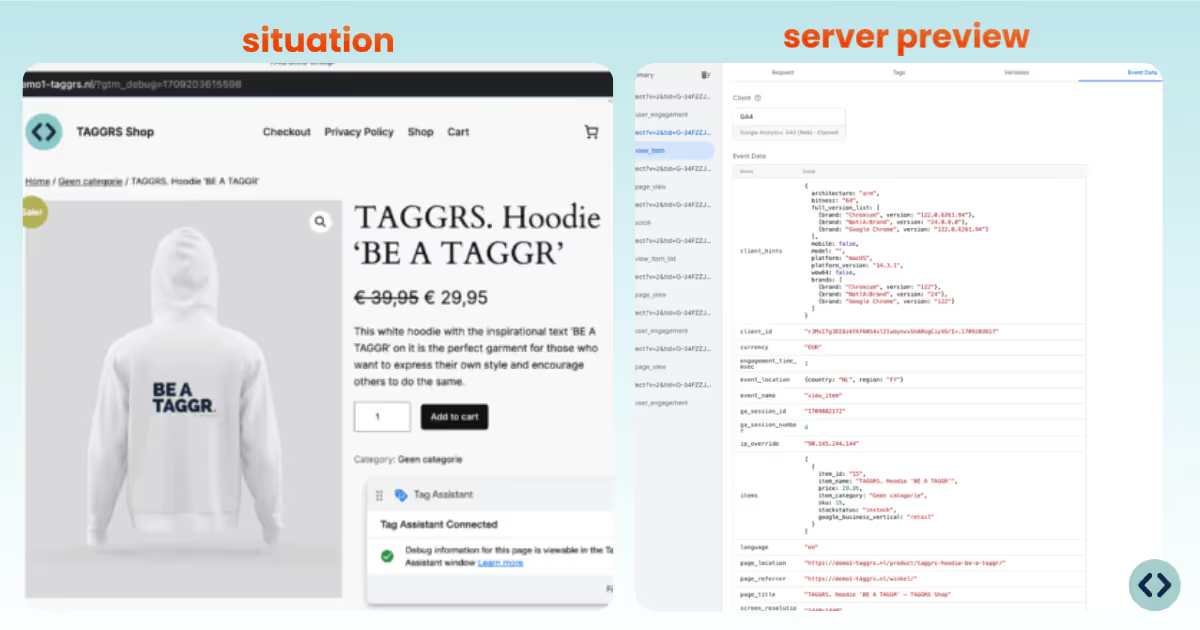
You don't literally work in the Server Container with data layer structure but with names of parameters you pass.
After activating the appropriate tags, the next step is to verify that the data has been processed correctly in the corresponding platform. You can assess this through the debug modes of the platforms themselves, or using various Debug Chrome extensions.
Within TAGGRS Server-side Analytics Dashboard, you can verify the following:
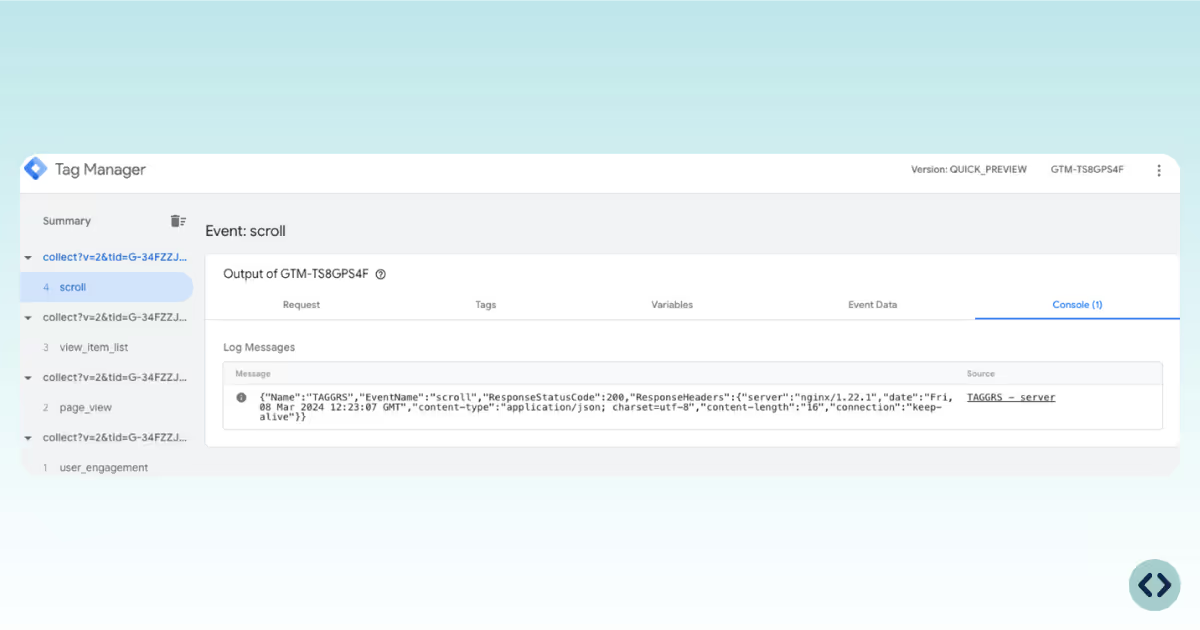
The web container may show errors similar to what you would see in the console, while the server container has a special console tab added.
This debug tab can provide useful additional information for debugging. This is a debug tab that can provide additional information that may be useful for debugging (not important).
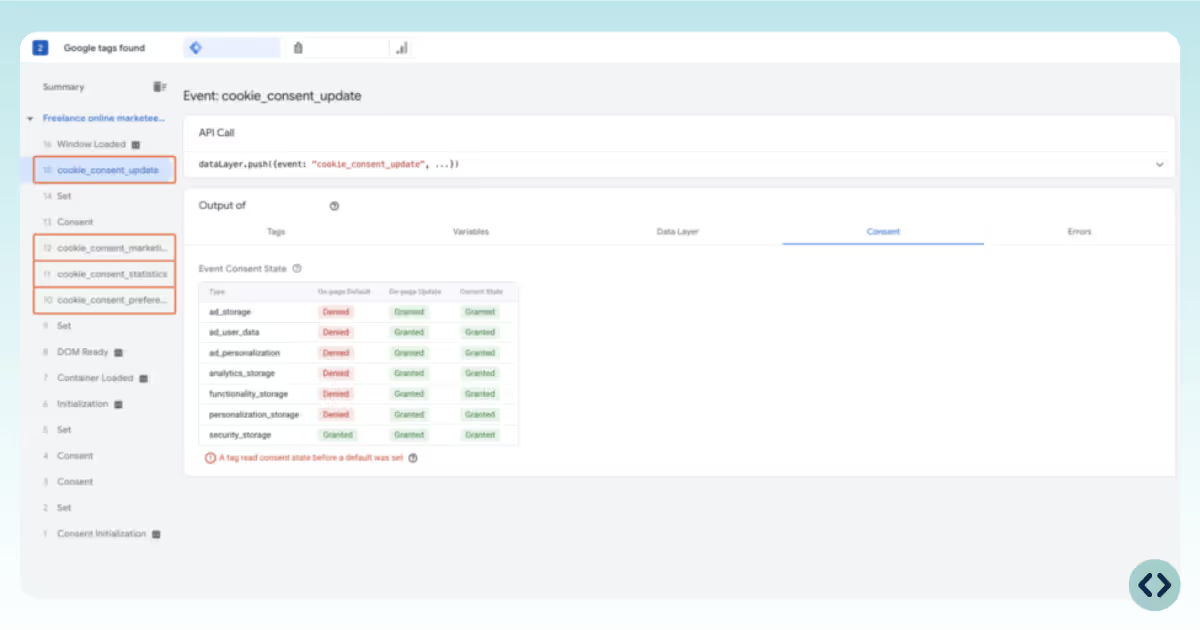
If you have configured permission (consent) settings, for example with Consent Mode V2, this tab shows which consent statuses have been set and fired, which is particularly useful for debugging consent mode v2 and also for checking default settings.
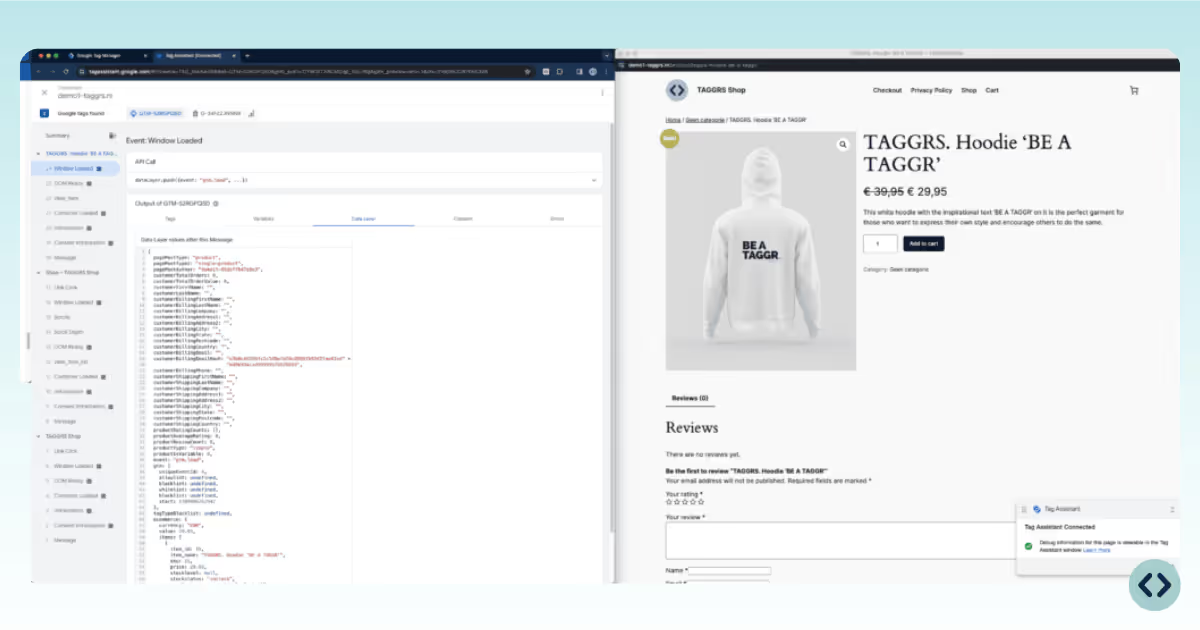
In web container preview mode, the Data Layer tab provides essential information about the structure and data sent by the web site for tracking purposes. This is an important source of information for all tags that depend on the data layer to function.
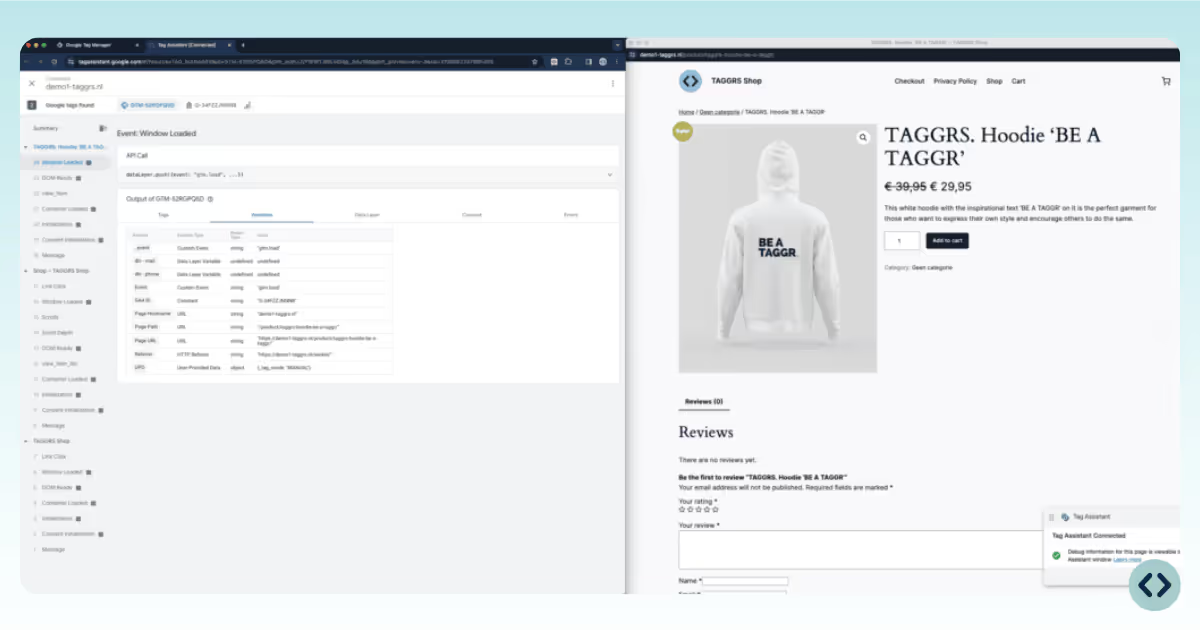
The Variables tab lists all available variables within the container that can be used for setting triggers or defining tag configurations. This tab is important for understanding what data is available for use in tags and triggers.
Once verified, publish the updated server container to make the transformation live.
Setting up server-side tracking involves moving parts across both web and server containers. Even with a careful manual setup, misconfigurations are common and hard to spot, and when tracking underperforms because of a setup mistake, it's easy to lose confidence in the data.
The Tracking Audit Tool removes that uncertainty. Once your setup is live, use it to automatically scan your entire GTM infrastructure, both web and server containers, directly from your TAGGRS dashboard. It checks for the most common tracking pitfalls in seconds, replacing what could otherwise take hours of manual debugging in GTM preview mode.
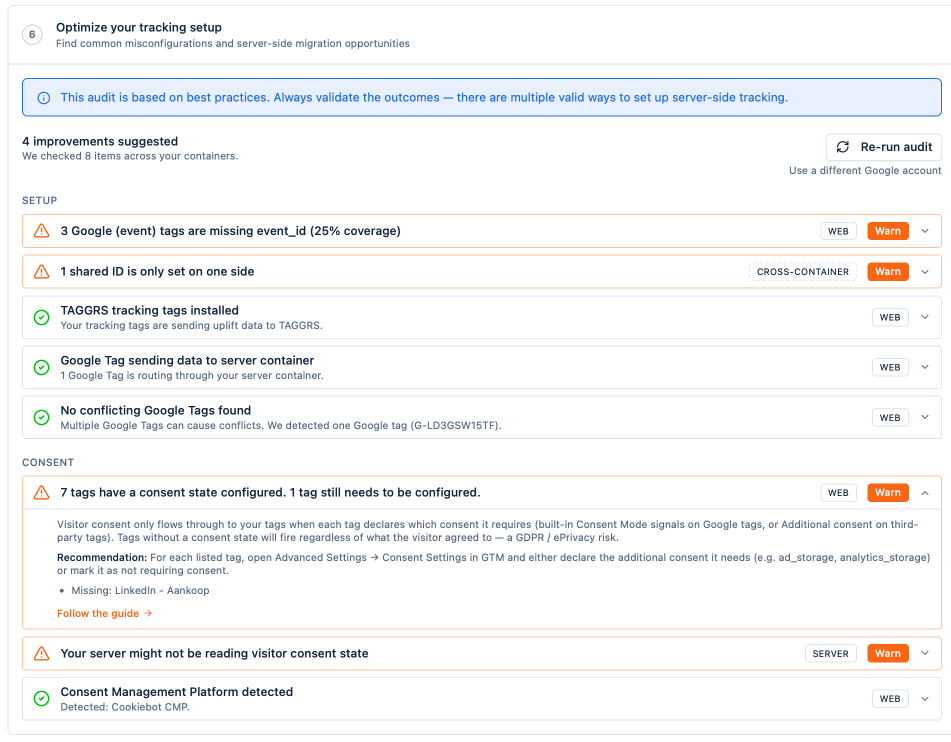
How to access it: Go to your TAGGRS dashboard → Overview → Optimize your tracking setup (step 7).
Here are the common issues preventing the tags from firing, hands-on solutions, and two specific situations that require a more targeted approach to troubleshooting.
The general reasons why a tag doesn't fire are:
gtm.blocklist and gtm.allowlistThe general reasons why a tag doesn't fire are:
Check in preview mode if the GA4 tag is firing. If it fires in the web container but not in the server container, check if the Measurement ID (Web Container) and the Tag ID (Server Container) in the GA4 Configuration tags match.
Understanding the nuances of why a tag might not be firing is crucial for diagnosing and fixing the issue.
Follow the steps outlined above to troubleshoot and resolve common tag firing issues in Google Tag Manager. Remember, detailed testing and verification are key to ensuring that your tracking setup works as intended.

In situations where Google Tag Manager's debug mode shows page views but fails to register e-commerce events, the issue often lies in the alignment between the Google Tag's Measurement ID and the e-commerce configuration. It's crucial to ensure that the Measurement ID used in your Google Tag setup matches exactly with the one configured for e-commerce tracking. Discrepancies between these IDs can lead to page views being tracked correctly while e-commerce events are missed. Double-check these configurations to ensure consistency and correct tracking of all desired actions on your site.

Also make sure you don't have any duplicate Tracking Script in Code. In some cases, we see that the Google Tag Manager script is loaded in multiple ways in the code, often through manual placement + via a plugin. This can disrupt tracking in some cases.
So, always check if there is a tracking code (per container) in the code.In the screenshot below, you can see that tracking is sent to multiple sources. Ideally, you want only server side domains to be listed here where you send the data. Otherwise, events can be hijacked by the others.

After implementing Server-side Tracking via TAGGRS, you get errors when opening the console in the browser. Often these errors are harmless or easily fixed. Here are listed all situations and solutions for console errors after implementing our software.
When you get the ERR_BLOCKED_BY_ORB 200 Error in the console it means that our TAGGRS Tracking Tags pixel is blocked by tracking prevention (see for example Safari 26's updates) due to browser prevention and regulations. When TAGGRS Graphs about extra data due to Server-side Tracking, a pixel is used via the web container. When you see ERR_BLOCKED_BY_ORB 200 it means it is being (partly) blocked. This has no impact on your tracking, this is purely the extra data graph!
Should you come across any of the errors listed below while integrating the GTM code, rest assured: the code will remain functional.

Seeing a 400 error in the console typically indicates a missed step in establishing client creation within the server container, an essential phase in configuring the Enhanced Tracking Script.
When using the Enhanced Tracking Script, there is no need to maintain a huide Google Tag Manager code. This is because then two different tag managers (the old one and the Enhanced Tracking Script) are loaded at the same time. To solve this problem, the original GTM code should be removed after activating the Enhanced Tracking Script. Only the GTM code of the Enhanced Tracking Script remains.
Reaching the request limit (TAGGRS Dashboard) can cause Tag Manager to pause and tracking to halt. It is vital to understand that after implementing the Enhanced Tracking Script, exceeding the request limit will interrupt tracking functionality. Monitoring and managing the request limit is therefore crucial to ensure continuous tracking.
Encountering no requests in your Magento 2 server container for Server Side Tracking? This often results from Magento's CORS rules, designed to block outgoing requests as a security measure. To fix, adjust your .htaccess with Header add Access-Control-Allow-Origin "https://*.yourdomain.com", replacing "https://*.yourdomain.com" with your subdomain, thus ensuring your requests are allowed. Check our Magento 2 No Request article.
Allow ParametersExclude ParametersEvent Enrichment