
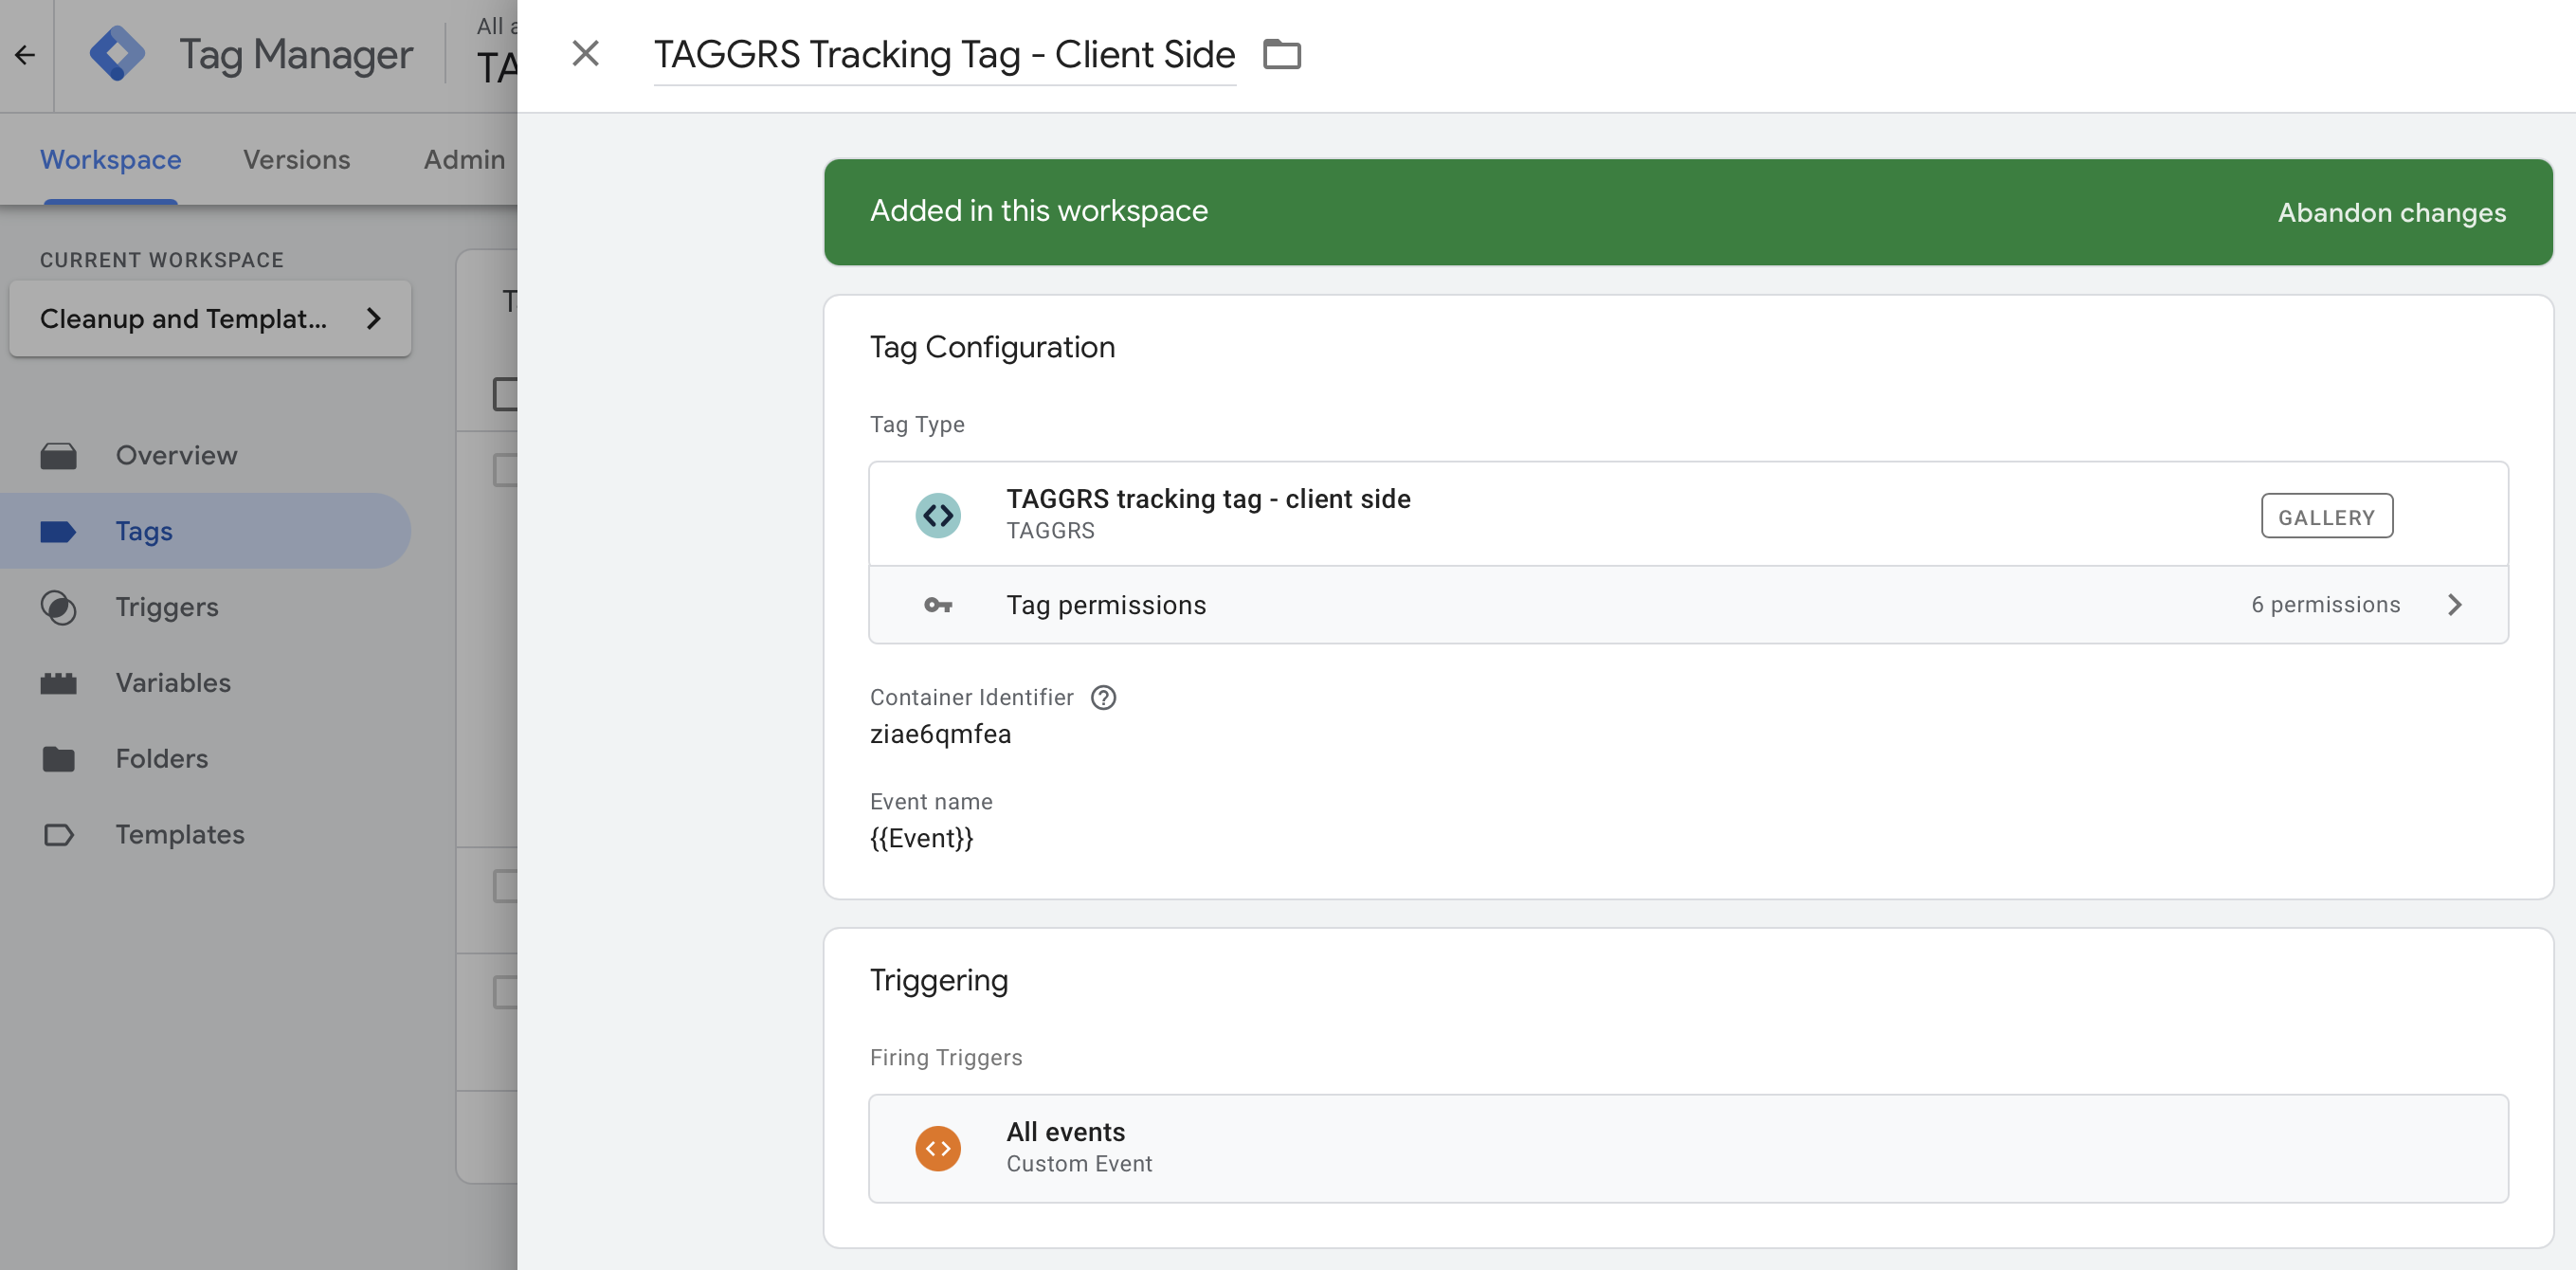
Go to your web container in Google Tag Manager. Within your workspace, go to Tags, then click New. Click on Tag configuration, then go to the Tag library and search for TAGGRS tracking tag - client side. Add it to your container.
Go to your TAGGRS product and open Settings to find your Product ID. Copy it and paste it into the Identifier field of the tag.
At Event name, add the All events variable.
Choose the trigger that fires on all events, give the tag a name, and click Save.
The tag is now configured and ready to send data to your TAGGRS product.
Publish the latest version of your GTM container.
The server side is measured based on the events that are actually sent to the server container, so you don't need to configure a separate tag for this.
Once you open your Server-side Tracking dashboard, you'll see the data appear in the Signal Comparison graph.
If you already see a positive difference and want to increase it further:
• Implement the Enhanced Tracking Script. It improves client-side resilience against advanced ad blockers (≈1–2% uplift)
• Enable Cookie Recovery. It restores tracking cookies removed by Safari and iOS. Mind: it requires the Enhanced Tracking Script.
• Use Webhooks for critical events.
It ensures purchases are tracked even if users close payment flows early. Please mind that it is not not suitable for Google Ads (no GCLID support).
A negative data difference means that fewer events are received server-side than client-side. This is usually caused by configuration issues rather than TAGGRS itself. Below are the 6 most common causes, ordered from most to least frequent, along with practical guidance on how to identify and resolve them.
Many websites have evolved over time and often contain old GA or GA4 scripts, direct Google Analytics integrations, plugins that inject tracking code, and a Google tag configured outside GTM. When this happens, client-side data is sent multiple times, while only one stream reaches the server container. If you see more than two “container loaded” blockchain your GTM Preview mode for the web container, extra tracking is active.
How to fix:
1. Remove legacy GA / gtag scripts
2. Ensure GA4 is implemented only via GTM
3. Use one single Google tag as the data source.
Some cookie banner solutions block tracking requests selectively. In certain setups, the client-side tracking tag still fires and the GA4 / Google tag request to the server container is blocked until consent is given. This results in client-side data being collected while Server-side Tracking is suppressed.
Common scenario:
• You browse the site before accepting cookies
• Client-side TAGGRS tracking fires
• Server-side data does not arrive
How to fix:
1. Configure Consent Mode v2 correctly in the web container
2. Ensure that analytics storage consent is aligned for client-side TAGGRS tracking tag and server-side TAGGRS tracking tag.
Mind: disabling automatic cookie blocking may solve the issue but is not compliant with privacy regulations.
In some cases, GTM is loaded multiple times: 1x manually in the code and 1x via a CMS or plugin. This can disrupt event flow and data forwarding to the server container.
How to detect:
Right-click → Inspect → search for GTM-. If you find the same container ID twice, one must be removed.
Ad blockers can sometimes block the request from the web container to the server container, even if Server-side Tracking itself is functioning. This usually results in a small but noticeable decrease in the data difference shown in the TAGGRS dashboard. To solve this, implement the Enhanced Tracking Script.
If GA4 is implemented outside of GTM (for example via a plugin), some requests may bypass Google Tag Manager entirely. As a result: not all events are forwarded to the server container and Server-side Tracking receives fewer events than expected.
How to check
1. Inspect the page source for gtag( calls
2. Look for GA4 plugins in your CMS
3. Verify that GA4 is routed exclusively through GTM.
If only page_view appears in the TAGGRS Dashboard, the GTM trigger is likely set to All Pages instead of All Events.
You can fix it by updating the trigger to use Custom Event with regex .*
Most common reasons:
• Consent mode active in web container but not in server container
• Duplicate events added directly in GA4
• Server-side Tracking tag firing without a specific GA4 client
• Additional direct GA4 integration bypassing GTM.
Always specify GA4 Client in server-side triggers.
Possible causes are:
• Fewer than 10 events recorded (minimum threshold)
• Data processing delay (up to 30 minutes)
• Incorrect trigger configuration.
Use GTM Preview mode to verify that both tracking tags fire correctly.
We use the info for statistics for our TAGGRS Server Side Analytics. So for Consent Mode V2 you can use statistics as Consent State for our tracking tags.